Statistics: Distributions – The Empirical Rule
In my Distribution Shapes article, I discussed the different shapes most distributions of data would visually utilized, with symmetrical being the most common.
These bell-shaped distributions demonstrate the “empirical rule” which demonstrates a relationship between data points and standard deviations placement in relation to the mean.
The distribution below demonstrates a bell-shaped distribution. The mean is illustrate in the center by a red line. On either side of the mean are three black lines, each illustrated one of three standard deviations. Outside of the third standard deviation are data points which is statistically-insignificant.
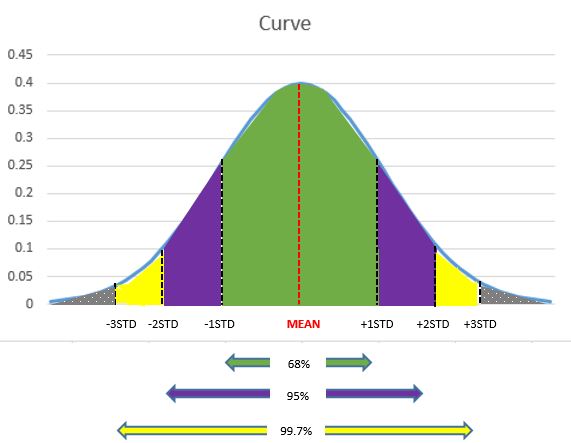
Visually displaying three standard deviations in relation to data points provides a very intuitive overview of how many fall within each area.
The empirical rule states the following estimates with relation to data points and standard deviations.
| 1 STD | 2 STD | 3 STD |
|---|---|---|
| 68% | 95% | 99.7% |
Conclusions
- Since 99.7% of data points are illustrated within three STD, .03% will fall outside of these measurements.
- Determining the amount of data points which constitute the difference between two STD may be obtained by simply subtracting the large percentage from the smaller percentage.
- For example, to determine the amount of data points between the third STD and second STD, I would use 99.7% – 95% = 4.7%.
