Please see me my other Excel articles.
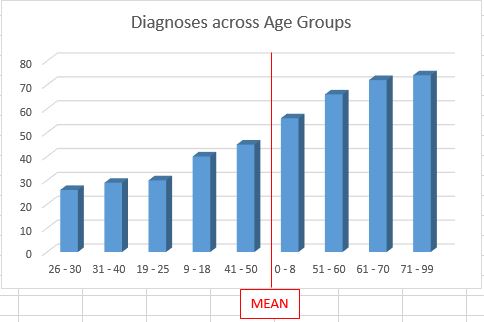
Leveraging Standard Deviation to Understand Data Dispersion
In my Variance article I illustrated how to use variance to understand the average of all variances squared from the mean.

In this article I will demonstrate how to determine standard deviation, which is simply the variance, squared.
Excel provides the STDEV.P() function to use the data set to determine the standard deviation, in this case for the population (all values versus a sample).
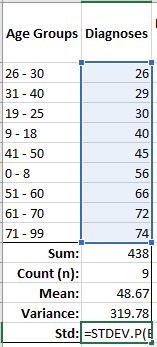
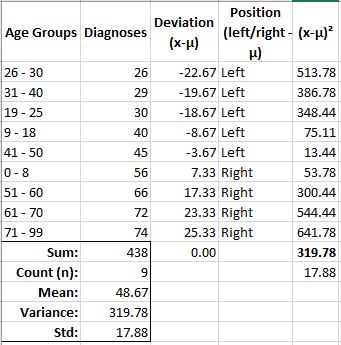


Also, notice the standard deviation (Std – 17.88) is the same value as what I produced by using the total under the variance column, and squaring it.
The standard deviation of 17.88 means the average deviation from the mean (see Deviation column) is 17.88.
