Please see me my other Excel articles.
Using Variance to Determine Dispersion
In my distributions articles (stats link) I illustrated distributions and how their shapes may be understood in terms of data points and their relation to the mean.
Since the mean represents the average of all values, understanding the spread of all data points, or the average distance data points from the mean would be very helpful.
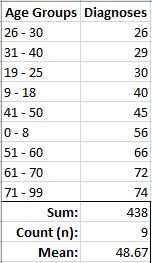
I’ll begin with a simple data set of disease diagnoses for each age groups to demonstrate how to use Excel to determine variance for a data set.
As you can see, the average diagnosis for all diagnoses (438) is close to 49.
Deviation
Variance represents a difference between two measurements, in this case how far a data point resides from the mean.
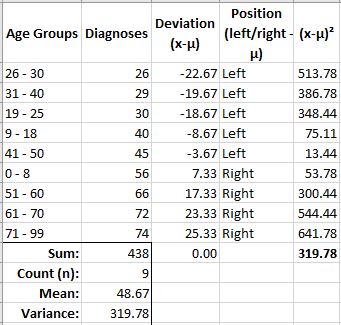
First, I’ll calculate the variance for each data point to see how far away each data point resides from the mean.
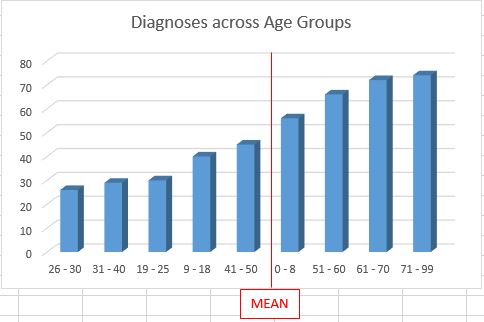
Note: negative values denote data points falling to the left of the mean with positive values falling to the right.


As you can see, the Deviation column now shows how far each data point resides from the mean. For example, the first data point for the Age Group 26 – 30 has a diagnosis of 26, which is almost 23 (22.67) from the mean of 48.67.
Deviation is another word for variance to represent this difference of the data point from the mean.
Remember from above the negative symbol denotes data points which fall to the left of the mean and positive values fall to the right.
Now, I’m going to produce a square of all the deviation values, ending with an average of them at the bottom.


Excel provides a very helpful function to determine variance for a data set which produces the same value for variance as the last image (319.78).

As you can see, the VAR.P() function produces the average of all variances squared from the data set as illustrated in the table above.
