Understanding Distribution Shapes and Central Tendency
In many of my BI articles I discuss data and its measurements, one of the most commonly used being the mean (link) or average of all values within a data set. A data set contains many data points, their arrangement around the mean and their probably of occurrence is typically referred to as its distribution, or how the data points are shaped in relation to the mean and probability.
See my empirical rule article for a more full explanation of probability and data points..
In this article I will describe three primary distributions of data you will encounter and how each distribution affects its central tendencies of data (link) (median and mode – links).
Symmetric
The most common distribution of data is symmetric – where data points are evenly distributed between the left and right sides of the data, with most data points residing within the center of the distribution.

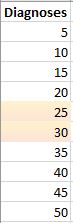
I created this graph beginning with the following data set.
First, for each diagnoses I use the following formula to derive each value’s distribution. This return’s a value which helps to understand each value’s placement within a normal distribution curve in relation to the mean, using the mean and standard deviation (link).

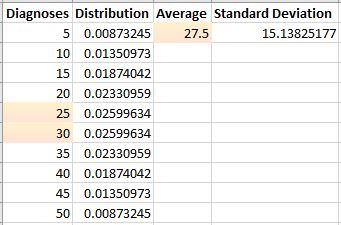
Notice in the data set and “Average” value (mean), the mean is 27.5, about halfway between the vertical values of the Diagnoses x-axis. To put it another way, the mean equally divides the graph with half of all data points residing on both sides. This observation is typical of all normal, bell-shaped distributions.
The last step in creating the graph is to simply highlight all Diagnoses and Distribution values and create an X-Y Scatter chart.
Left-skewed (Negative)
Left-skewed data distributions are characterized by a distribution shape where most data points reside the right-side of the chart along with the mean, with the smallest portion, or tail, stretches to the left side. This type of distribution is referred to by the direction to which the tail points away from the bulk of the data points.
These types of distribution shapes are also called negative because the tail points toward the negative standard deviations and because of the following value relationships with regards to central tendency (link): Mean < Median < Mode.

Right-skewed (Positive)
Right-skewed data distributions are characterized by a distribution shape where most data points reside the left-side of the chart along with the mean, with the smallest portion, or tail, stretches to the right side. This type of distribution is referred to by the direction to which the tail points away from the bulk of the data points away from the bulk of the data points.
These types of distribution shapes are also called positive because the tail points toward the positive standard deviations and because of the following value relationships with regards to central tendency (link): Mean > Median > Mode.

