Understanding Causes of Skewed Distribution Shapes
In my Distribution Shapes article I illustrates the three most common shapes founds with distributions – symmetrical, left-skewed, and right-skewed.
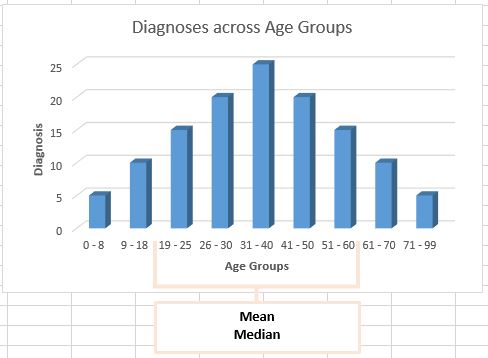
Symmetrical distributions display data points equally on both sides because most of the values reside near the mean (average). This near-uniformity of data points with the average prevents the distribution from being pulled from one side to the other.

Skewed Distributions
However, in many data sets some values reside so far from the mean, they cause the distribution to be pulled into that direction, causing it to appear as it has a tail. Depending on which direction these anomalous values, or outliers, reside, that is the direction to which the tail will stretch.
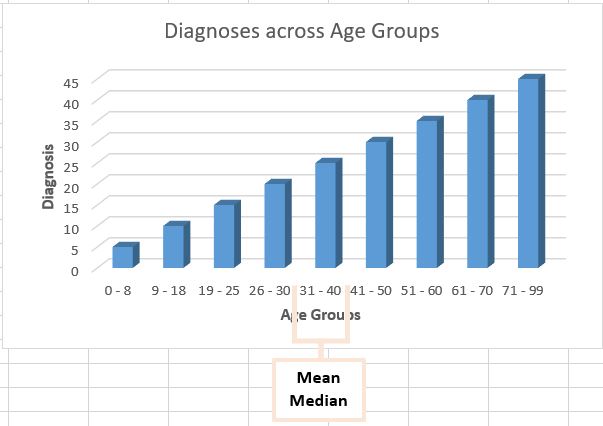
For example, if you see a distribution which appears to stretch to the left, or “left-skewed,” it is the result of outliers residing to the left of the distribution’s mean visually, which resides to the right of the center of the distribution.

Conversely, when a data set’s values reside further to the right of its mean, visually the distribution will appear to have a tail stretching to the right, creating a “right-skewed” distribution.