Using Foreknowledge of Data Set Changes to Understand the Effects
In most data studies, the original data set is modified to tease-out certain patterns.
Knowing how certain changes affect metrics may prove a very useful tool when communicating results to clients.
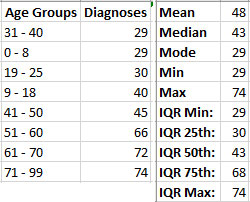
In this example, I will begin with a simple data set illustrating disease diagnoses per age group.
The data set is sort to show lowest rates to largest.
Next to the data set are a series of measures to show central tendency as well as other metrics to illustrate range (Min, Max) and quartiles (“IQR…”).
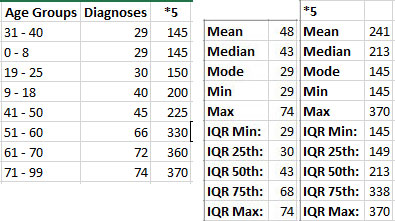
Increase Data Set values by 5
First, I’ll illustrate the effects of increasing all values by 5.
This change results in all measures increasing by the same value. Note all measures of central tendency are exactly 5 more as well as the ranges and quartiles.
Also, decreasing data set values results in the same effect on measures.

Dividing Data Set values by 5
The same effect may be observed when dividing values by a constant value.

Multiply Data Set values by 5
Also, multiple values by 5 (constant) affects measures by increasing their values by the same multiplication value.
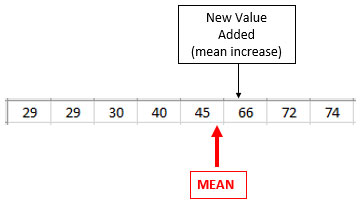
Add New Value Above Mean
In this example, instead of changing all values and noting the effect on all measures, I’ll simply add one new value (52) to the data set, above where the original mean (48) is located.
Since I added the new value above the current mean value, the mean was increased.
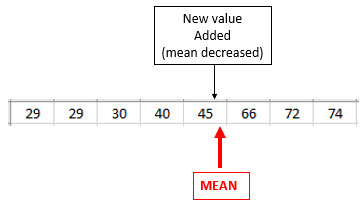
Remove Value Below Mean
Next, I’ll perform another change to the data set, but this time below the mean, and I’ll remove an existing value (45).
Notice the mean (48) increased by 1.

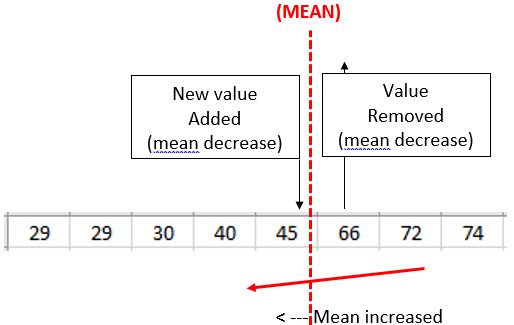
As you have seen, there are two ways to increase the mean – add a new value above it or remove a value below it.
What you are seeing is the nature of a data set in relation to its mean. Think of the data set as a board resting on a log. The mean always rests in the middle of the board (data set). When one side of the board (data set) is tilted, the center (mean) is moved left or right. The center always remains in balance on the board.
Depending on where you add or remove a value, the mean is moved to the right or left. In the first example, the new value was added after mean, pushing the board (data set) down, causing the mean to slide (increase) right. In the second example, the value was removed before the mean, causing the board (data set) to tilt up, sliding the mean (increase) right again.

Next, we will look at two ways to decrease the mean – tilt the mean the other way.
Remove Value Above Mean
By removing an existing value (66) below the current mean (48), the the mean (48) is decreased by 2.

Add New Value Below Mean
Similarly, adding a new value (46) below the mean (48), decreases it.
As you can see, there are two ways to decrease the mean – removing a value above the mean and adding one below it. Again, notice how tilting the board (data set) down to the left, causing the center (mean) to slide left.


| Action | Effect on Central Tendency (Mean, Median, Mode) | Effect on Range | Effect on Quartiles |
|---|---|---|---|
| Increase/decrease values by constant | Values increased/decreased by same constant | Increase values by same constant | Increase values by same constant |
| Divided/Multiplied values by constant | Values scaled (up/down) by same constant | Values scaled (up/down) by same constant | Values scaled (up/down) by same constant |
| Add value above mean | Mean increased | N/A | N/A |
| Remove value below mean | Mean increased | N/A | N/A |
| Remove value above mean | Mean decreased | N/A | N/A |
| Add value below mean | Mean not affected, median increased | N/A | N/A |
