Please see me my other Excel articles.
Describing Central Tendency of Data
Descriptive statistics is concerned with summarizing data using measurements.
Here’s an example of descriptive statistics using the following data set:
There are 20 statistics classes at a university for which all the ages of the students in one class have been collected – a population (“all the ages”).
A descriptive question would ask “What is the most common age in the class?”
Mean, The “Average”
One of the primary concerns of descriptive statistics is the measures of central tendency – how a set of numbers representing the “center,” describing an average.
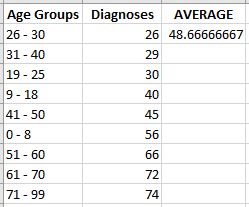
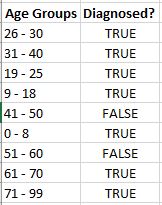
In this article I’ll begin with a simple data set reflecting disease diagnoses by age group.

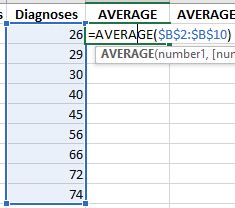
To present the mean of diagnoses, I’ll use the AVERAGE() function, providing the entire data set as the single argument.
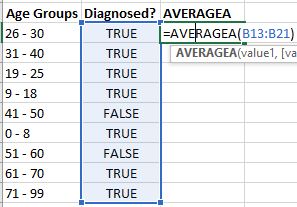
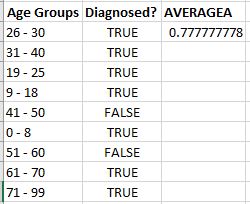
If I would like to use a little more complexity when calculating the average, I may use the AVERAGEA() function.
In this example, instead of a number with each age group, I simply have TRUE/FALSE values to denote if a diagnosis was made.
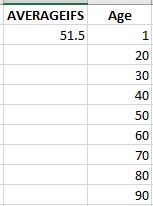
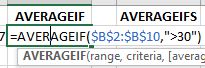
If I need to provide criteria to determine how the average is calculated, I may use the AVERAGEIF() function.
In this example, I’m stipulating to only use diagnosis values above 30, or rows 5 – 10.

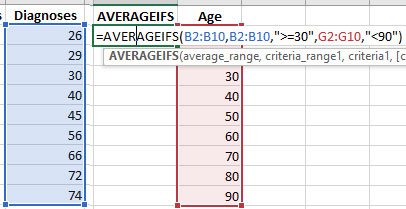
Finally, I will demonstrate how to determine the average using two ranges, each with their own criteria.
In this example, I’m only using diagnosis values above 30 from the Diagnoses range, then from the Age range I only want Age values used less than 90.