Using excel to query the database to produce reports.
Using the ubiquitous Office application Excel, users may easily perform queries against your database to display reports within the worksheet and then utilize Excel’s robust tools to customize their reports.
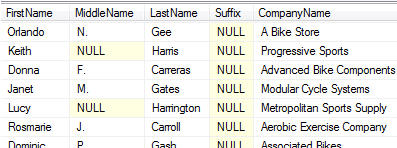
For this example, I’ll begin with a simple customers tables from AdventureWorks db.
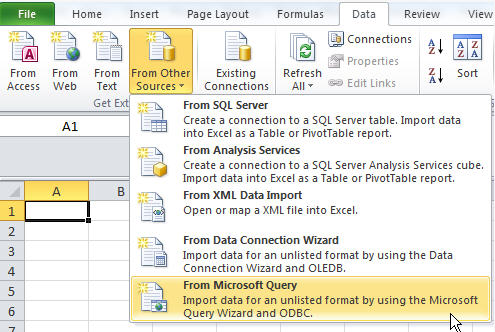
First, I’ll open Excel and create a new connection “From Microsoft Query.”
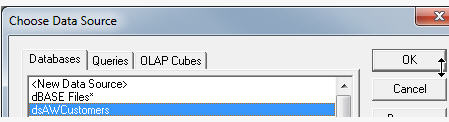
When prompted, create a “data source.”
Give the data source an intuitive name for ease of use and select the appropriate driver, then “Connect” and configure the “Login.”
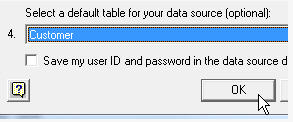
Also, you may select a “default table” for the data source. the data source is now listed, click “OK.”

Next you will be prompted to select which fields to display, give the option to reorder them, and see a preview of each field’s data. Click “Next.”

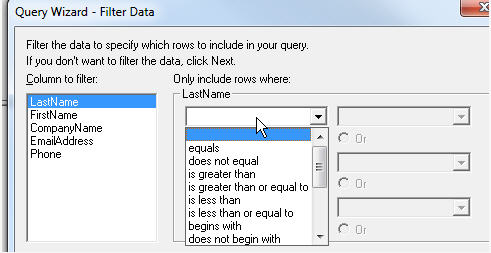
Next, you will be given the opportunity to apply filters.
Next, I will configure sorting on three of the fields, then “Next” and “Finish.”

Finally, I will prompted for a location to place the result set.
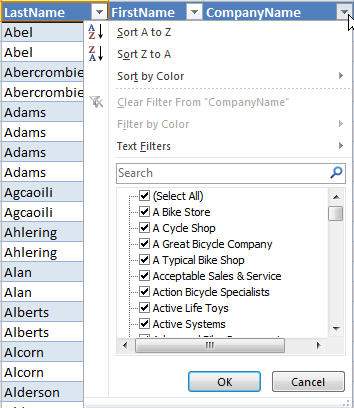
Upon completing the final step, Excel displays the result set within the spreadsheet along with filters for each column.