Understanding event outcomes by their frequency.
One of the most important patterns studied within statistical research are frequency distributions and their cumulativeness to understand events.
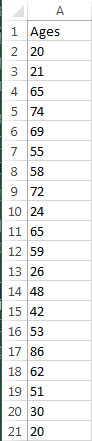
In this example we’ll begin with a dataset illustrating adult student ages with the goal of understanding how often certain-aged students participate in school.
Next, I’ll add to my spreadsheet the following columns: Age Intervals to denote the lower and upper bounds of each age interval I wish to study, Upper Limit to denote the largest value within each interval, Frequency to contain how often ages within each interval occurs, and Cumulative Frequency to determine when compared to all previous intervals, how often each occurs.

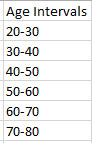
Now I will determine and fill-in Age intervals to study.
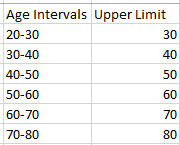
For each interval I’ll update the Upper Limit column.
Now it is time to leverage Excel formulas to perform statistical analysis.
First, I’ll use the FREQUENCY() function to calculate values for the Cumulative Frequency column by referring the list of ages and each interval’s Upper Limit. Next, I’ll duplicate (drag) that formula to all remaining cells in that column for each interval.


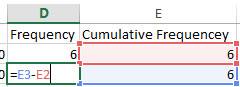
Now I’ll populate my Frequency column by beginning with the first value in Cumulative Frequency, then subtracting each subsequent frequency from the previous value for all frequencies.
As you can see, students ages 20-30 constitute the most common age of students with the second group being 50-60, no students between 30-40, and a total of 19 students.
