Calculating a New Column from Existing Columns
When solving a data problem sometimes you are not provided all values and need to create new values by calculating existing values.
In this example, I will demonstrate how to create a calculated field from an existing dataset showing sales by region.

I’ll begin by connecting to my data source, loading the data, and opening the dashboard.

In this example, I want to show the three highest salespersons in each region. Since the values need to be displayed by salesperson (x-axis), I’ll drag the salespersons dimension onto Columns in the work area.

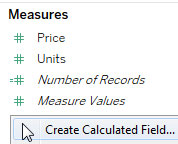
Now, I would drag the sales costs measure onto the chart, but not such value exist.
I must create a new value, which is the result of calculating Price by Units – a new calculated value.
In pop-up window, I’ll name the new field and in the blank area, use Intellisense and field names to build a formula for Total Sales.
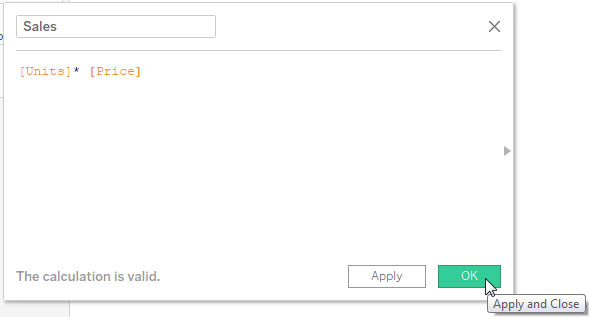
Now I have a new calculated Sales field.

Now, I’ll drag the Sales measure into the Columns area and I have chart displaying Total Sales by Salesperson.

Now I’ll group the each Salesperson by region by inserting the Region dimension before the Salesperson in Columns.

Though all sales values are displayed by region, it is still not clear which Salesperson has the highest sales.
Now, I will use the sort button on the y-axis to display the highest sales for each region first.


Pingback: Tableau: Styling With Colors | TechMbaBi