Adding a graphic to the header of a report.
Most reports require some sort of identifying header at the top of each page.
While the header itself may be text, using a graphic provides a more polished look (though in my example I use a plain graphic).
I’ll begin with the report created for the Graphic Query Designer article to illustrate how to insert a graphic into the report header.
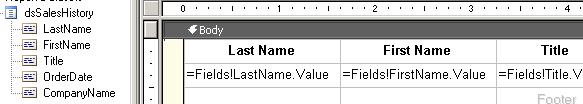
As you can see, I used my Dataset window to add the fields to the report and formatted the header row. However, the report still looks plain and lacks a header.
First, I’ll select to Add an Existing Item and add my header graphic to the project.
Next, I’ll show my report’s header region.

To make room for the header graphic, I’ll drag the separator between the Header and the Body.

From the Toolbox, I’ll drag and Image, select it from the Project, and select Finish in the Wizard.
Now, I have a header graphic for my report.

As I traverse pages, my header graphic remains to identify to the user the report’s purpose – “Sales History.”
