Using the graphic query designer to quickly construct sql to populate the dataset.
The Graphic Query Designer provides one of the most efficient methods for creating sql necessary to populate a report’s dataset and avoids and syntax errors by writing the sql for the user.
I’ll begin this example by creating a new dataset for my Sales History report.
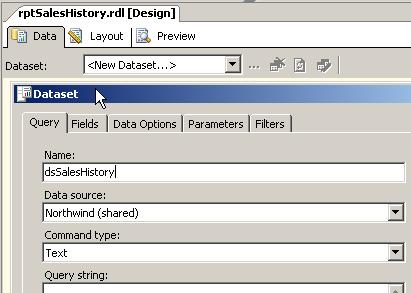
When the Data window is first loaded, it defaults to the Generic Query designer.

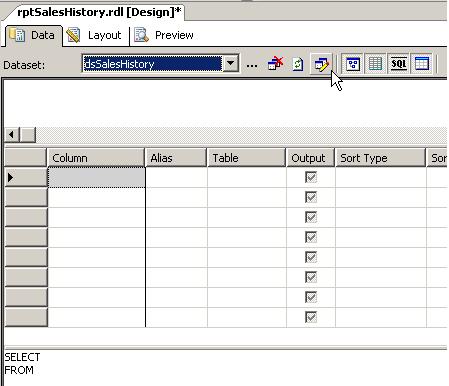
By deselecting that button, the Graphic Query Designer loads with the Diagram, Grid, SQL, and Results panes to easily construct sql for populating a dataset.
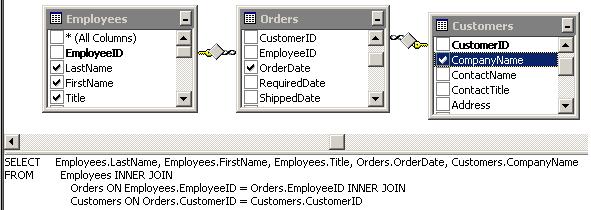
To show sales history, I’ll use the “Add Table” button (or right-click -> Add Table) to add the Employees, Orders, and Customers tables – notice the relationships are automatically discovered.

With the tables added, I’ll select those fields I wish to display in the report.
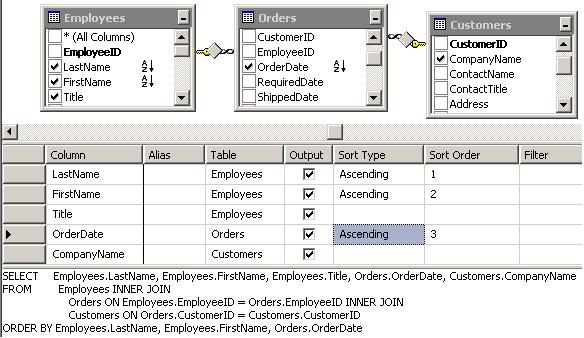
Using the Grid Pane, I’ll update the sort order accordingly.
By hiding all the panes except the Results pane, I can now execute the sql and view the results of my query.

