Please see me my other Excel articles.
Pie: Comparing Distributions of Data
Pie charts provide a mechanism to compare distributions of data within a circle with the different categories touching each other.
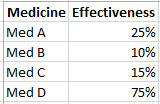
In this example, I’ll begin with a data set describing four medicines and their effectiveness.
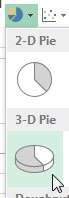
To create a bar chart, I’ll highlight the data set, use the Insert Menu and click the pie icon, then the 3-D Pie chart.
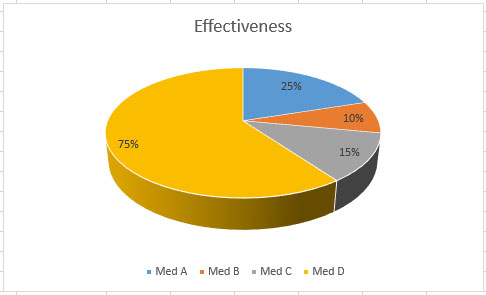
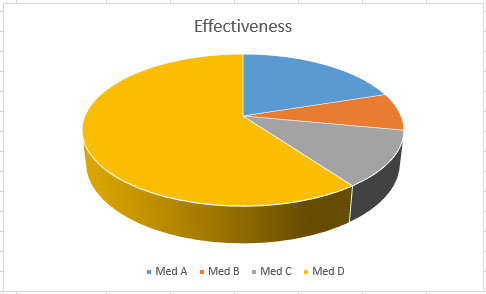
As you can see, the most effective medication is Med D and the least effective, Med B.
The margins between Med A and Med C are too close to see the difference so I’ll add data values to the graph.
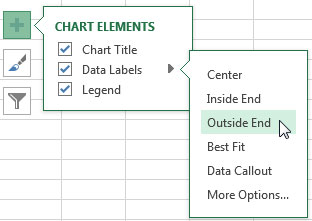
Now I can see the difference between Med A and Med C – 10%.