Please see my other Statistics articles.
Describing Central Tendency of Data
Descriptive statistics is concerned with summarizing data using measurements.
Here’s an example of descriptive statistics using the following data set:
There are 20 statistics classes at a university for which all the ages of the students in one class have been collected – a population (“all the ages”).
A descriptive question would ask “What is the most common age in the class?”
Mode, The “Most Common”
Mode represents a different focus of central tendency – the number found most often.
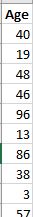
In this article I’ll begin with a simle list of Age values.
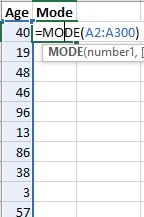
Now, I’ll use the MODE() function to determine out of all 200 ages, which is the most common.

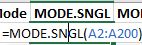
The MODE() function also provides a variant for specifying a single value to return. In this case 19 is also returned.

Since my list is to large, I’d like to know which other value(s) are most often repeated in my list.
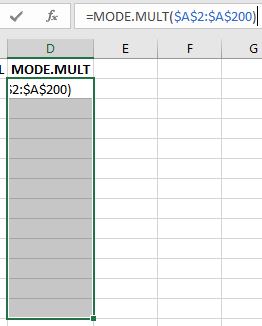
To do so, first, I’ll select a range of cells, in which to show other repeated values.
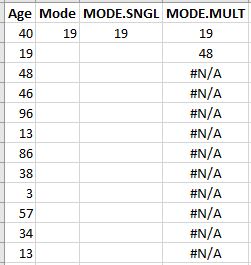
Then, in the formula bar I’ll enter “=MODE.MULT()” and the range.
Since this will return an array of possible values, I’ll use the [Ctrl] + [SHIFT] + [ENTER] combination to enter this formula as an array. Note how Excel wraps the formula in braces.
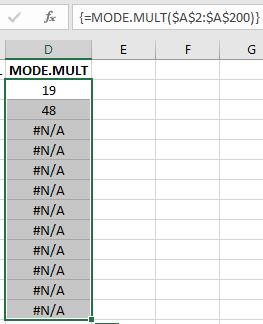
Excel scanned through all 200 ages to determine only two numbers repeated – 19 and 48.
“N/A” means no other values were repeated.