Using the Chi-Squared Test to Validate Results
When analyzing data it is important to demonstrate confidence the results found using the sample reflects would be found throughout the population, and not random phenomenon.
In this article, I will begin with a simple A/B Test determining between two age groups (1-50, 51-100) which constitute the larger group of music listeners which enjoy The Beatles.

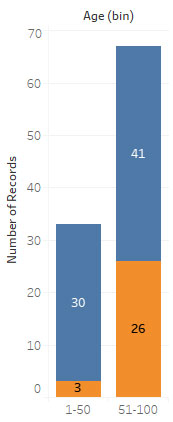

As you can see in the previous sample (100 records of 10,000), for the two Age groups (bin) of 1-50, and 51-100, the latter (older) age groups contains far more people who listen to The Beatles.
However, with this sample I am unsure if this small subset of the total population (10,000) reflects what might be observed throughout the data population.
Therefore, I will use a Chi-Squared Test to validate my sample results.
Chi-Squared Test Rules
This test is very useful for testing assumptions which exist with outcomes of statistical analysis.
The first step to complete a chi-squared test is to ensure observed values are absolute numbers or convert percentages to absolute numbers.
Next, ensure categories are mutually-exclusive. For example, if you have a categorical variable for favorite color, each person must have only one choice for favorite color.
Finally, when using the outcomes, ensure you don’t exclude any.
Chi-Squared Test Steps
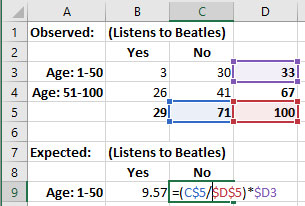
1) In Excel, create a table to contain values for those observed and expected from the chart.

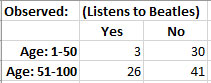
2) Populate your observed values.
For each age column, enter the “Yes” and “No” values from the chart.
3) Populate total observed values.
For each “Age” category (bin), sum the “Yes” and “No” values.
For each answer outcome (yes/no), sum the totals.
Finally, sum the answer totals for a grand total (100).

4) Populate expected value for the first category, “Yes” outcome.
Create a formula for the cell which calculates the following:
(Total Yes/Grand Total) * Total “Age: 1-50”
Ex: (29/100) * 33 = 9.57
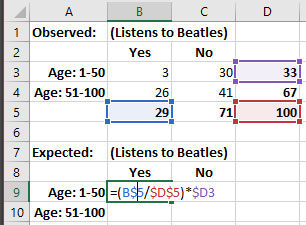

Notice the formula in the previous screen shot uses the ‘$’ symbol to “fix” columns and cells which are used in the formula. I do this so when I copy the formula to other cells, it continues to use the same cells in some cases, and in others, use a different column’s cell, but from the same row.
Reusing formulas allows significant time-savings in Excel and reduces user-error by avoiding retyping formulas.
For example, I want to reuse this formula to calculate the Expected “Yes” value for the “Age: 1-50” for the “No” value.
The “Yes” formula is:
(Total Yes/Grand Total) * Total “Age: 1-50”
(B5/D5) * D3
The “No” formula is identical except instead of using the Total Yes cell, we will use the Total No cell:
(Total No/Grand Total) * Total “Age: 1-50”
(C5/D5) * D3
Note: only the first cell changed in the formula.
Since the last three cells won’t change, we’ll “fix” their use by prepending ‘$’ to the column letter and row number.
When I copy B9 cell to C9, the formula changes the first cell used, but retains the same last two cells used as the first formula (Yes).

Now, I will replicate the “Age: 1-50” formula for “Yes” to the cell for “Age: 51-100” and the “No” cell, same row.

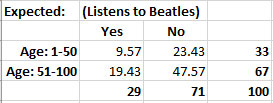
Now, like for the Observed values, I will calculate totals for the “Age” rows, “Yes” and “No” columns, and a grand total.
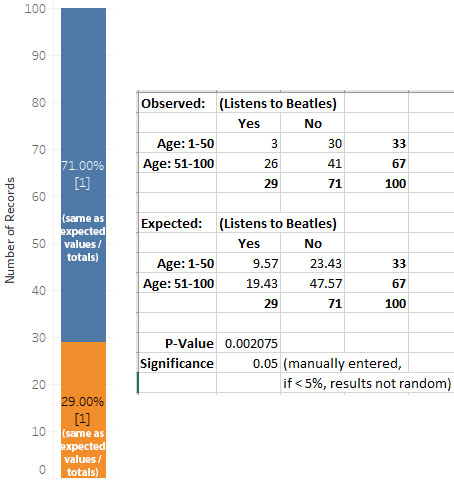
We now have values for Observed and Expected sections.
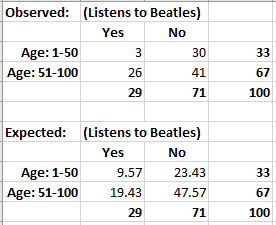
From this we notice the following:
• The totals from “Age” rows, “Yes” and “No” columns, and the grand totals between what was observed and what was expected are identical – no variance exists.
• A significant difference exists between the distributions of “Yes” and “Now” outcomes between what was observed and what was expected for both “Age” categories.
• The average outcome for all ages is 29% “Yes,” 71% “No.”
We will now calculate the P-Value using values from the observed and expected sections.


The low P-Value (.002) indicates the difference of distributions between “Yes” and “No” outcomes for both “Age” categories between what was expected and observed is not random and reflects what would be found across the entire population.
One final result remains – comparing total average percentages with expected outcomes.
When I convert the chart from absolute numbers to percentages for all ages, I see 29% of all people answered “Yes,” 71% “No.”
These percentages correlate to expected outcomes when compared with total values.
For example, 9.57 of “Age: 1-50” answered “Yes,” which is exactly 29% of the total outcome for that age. This 29% is exactly the same percentage as “Yes” for all ages.
Similar, the same percentage answered “No” for the same age as those for the same age for all customers.
This correlation may also be found for the expected “Yes” and “No” percentages of the totals for the next age group as totals for all users.