View Multiple Sheets to Understand Statistical Anomalies
In my last Tableau: A/B Testing Grades vs. Study Tutor article, I illustrated how to use Tableau to perform an A/B test to determine the effectiveness students of using a tutor and their outcome on grades.
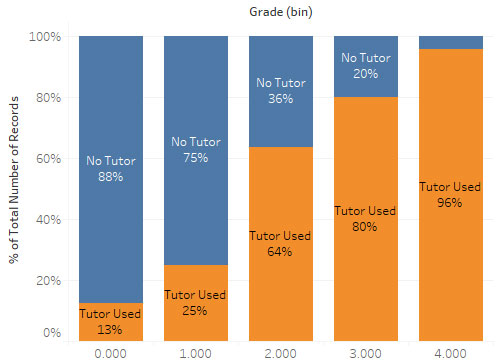
The chart illustrates, as the percentage of tutor use increases, so do the students’ grades – the orange area of the three highest grades (C – A) reflect this reality. Conversely, the largest blue areas (“No Tutor”) constitute most of the two lowest grades’ columns.
However, simply using numbers or percentages from a graph may not present a complete picture without evaluating all statistical realities with respect to the underlying data.
For example, grades within inconstant number of students might present skewed results.
Therefore, it is important to have a better understanding of the underlying data when comparing data.
In this example, I will show how to view the previous graph while looking at another graph showing each grade’s student count.
Since I want to compare another worksheet with the following chart from the previous article, I will keep Grade (bin) for my columns.
Since the Number of Records measure was used to populate rows for the first graph, I’ll start there and add it again to my Rows area.
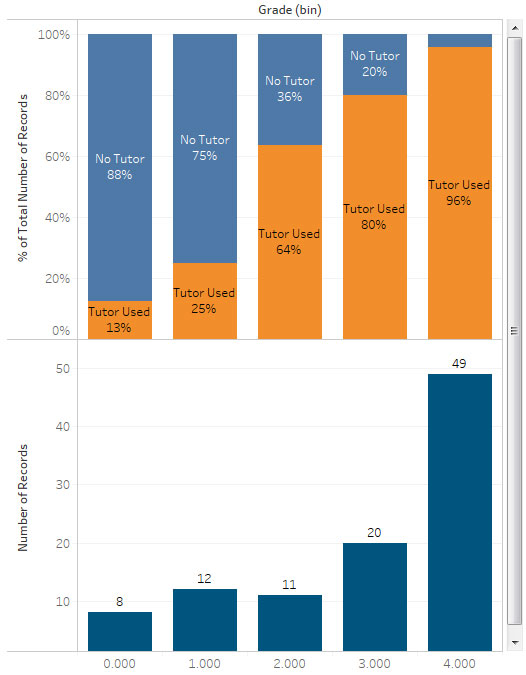
Immediately, my second graph is populated below the first one.

Also, I now have an All bar as well as a new bar for each graph named after the measure in Rows.
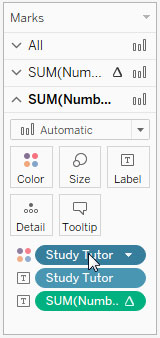
Since all I want to see are each graph’s student count, I’ll use the new SUM(Number of Records) bar to access that chart, and remove Study Tutor from the Color and Label area.
Also, I’ll remove the Number of Records table calculation which previously produced the percentages.
Finally, I’ll use the Color button to make my bars blue.
Now I’m able to see the greatest number of students reside within the highest grade. Therefore their 96% in the first chart at the top is statistically more significant than if only a few number of students achieve the 4.0 grade.
This example illustrates the importance of understanding all aspects of data underlying statistical analysis.

Pingback: Tableau | TechMbaBi