Using BIDS to Explorer Cube Characteristics and Data
With my cube designed and created, I will now leverage the BIDS interface to expose its rich features.
First, I’ll select the Customer dimension to Explore Data.

Now I’m presented with a series of sub-tabs which I may use to view Table data, use a Pivot Table, view a Chart, or use a Pivot Chart.
Table
Using the Table sub-tab I may view the dimension’s data, including using the headers to sort.

Pivot Table
Next, I may use a Pivot Table similar to that in Excel (link) to configure a report to view customer info and a YearlyIncome filter to view only customers which earn a certain amount.

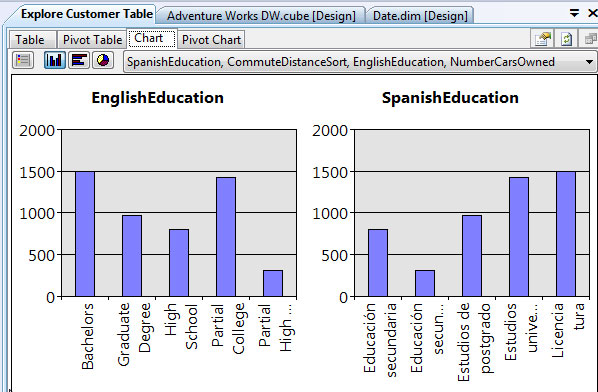
Chart
Using the Chart sub-tab, I can view data in graphical terms. Also, I may change the type of chart use and which attributes to display in the chart.
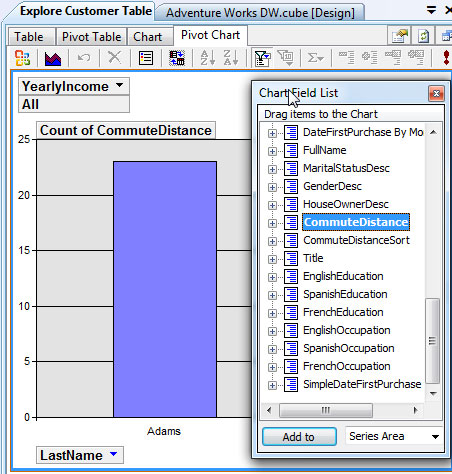
Pivot Chart
Finally, I may use the Pivot Chart sub-tab to add CommuteDistance to see a specific customer’s commute.