Using BIDS to Configure Cube Reporting
Microsoft provides a cube browser within the Business Intelligence Development Studio (BIDS) which allows a developer to view cubes and construct reports using dimensions and measures. The functionality is similar to using Excel to view and configure cube reporting.
For this article, I will use the sample data warehouse solution Adventure Works DW.
Upon opening the solution, I select the far-right tab “Browser” which exposes on the left a tree of measures (facts) and dimensions and on the right, an area in which to place both objects to create a highly configurable report.
 |
 |
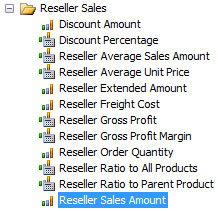
Within the Measure I’ll select the Reseller Sales and drag it onto the center area for “Totals or Detail Fields…”
 |
 |
Now I have a value on which I may build a report.
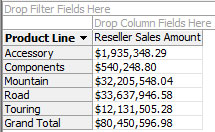
Out of the Reseller Sales Amount, I wish to see break down by product line. Therefore, under the Product dimension, I’ll drag the Product Line hierarchy onto the “Row” area. Now I have the sales amounts displayed by product line.
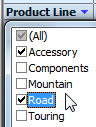
Also, I may choose to filter by different product lines.
Now I wish to filter the product line sales by geographies to see sales by state.
So I’ll drag onto the “Filter” area above the table. Also, I’ll select to see sales for “Alabama.”

Finally, out of Alabama’s product line sales, I would like to filter by fiscal years so I’ll drag onto the top “Dimension” area the Date.Fiscal hierarchy from the Date dimension. Next, I’ll select FY 2008.

