View the garbage collection in action
In this article I will demonstrate the .NET garbage collection working.
First, I’ll setup a loop which instantiates 10,000,000 Person objects using named parameters.

Next, I’ll set a breakpoint at the curly brace immediately below (outside of) the for() loop.
Now I’ll invoke the Diagnostic tools (Debug -> Windows -> Show Diagnostic tools) and run my app to see memory utilization.
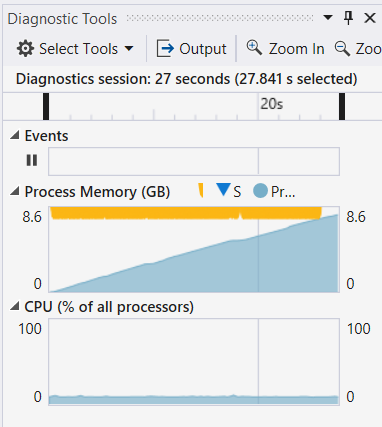
The tool shows gradual memory acquisition during object instantiation, to end with 8.6 GB or memory utilization.
This involves all those object variables on the stack and their values on the heap were never recovered.
The yellow bar represents garbage collection automatically occuring.
Note how memory isn’t yet recovered during execution.
Next, I’ll explicitly invoke garbage collection to see the difference in the diagnostic tool.


By explicitly invoking garbage collection, I now see less than half the total memory used compared to before and eventually, all 4.6 GB of memory were recovered.
Note: The .NET Framework automatically inspects at regular intervals (“generations”) for objects on the heap without their variables on the stack – orphaned objects, and recovers that memory. Therefore, it isn’t necessary to explicitly garbage collection.
