Describing Central Tendency of Data
Descriptive statistics is concerned with describing important aspects of set of measurements, organizing and summarizing data.
Here’s an example of descriptive statistics using the following dataset:
There are 20 statistics classes at a university for which all the ages of the students in one class have been collected – a population (“all the ages”).
A descriptive question would ask “What is the most common age in the class?” (18)
The “Average”
One of the primary concerns of descriptive statistics is the measures of central tendency – how a set of numbers representing the “center,” describing an average.
Mean, Median, and Mode
Mean
Mean represents the average of a dataset and the most basic procedure.
It is arrived dividing the sum of all ages by the number of ages in the group.
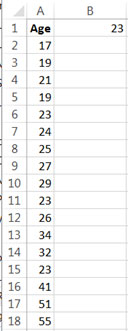
For example, using the Age values from 18 records, we can use the following Excel procedure to find the average or mean age value.
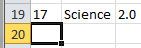
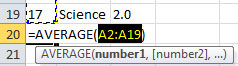
1) Place the curse below the last age (A20).
2) Select the Average function.
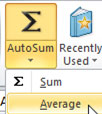
(The Average function will be inserted and populated for you with helpful prompts)
3) Press [ENTER]
(The Average age of 32 has been deduced)
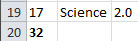
The average or mean age of all students is 32.
Median
While the mean represents the mathematical average of a group’s values, the median is the value which logically lies in the center of an ordered group.
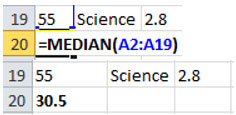
The same dataset is used in the last example, but reordered according to Age value.
When the Median function invoked (Formulas -> More Functions -> Median), the value 30.5, not 32 (mean), why?
 Since there are an even number of values, MEAN isolates the two numbers in the middle (29, 32) and uses the average of them both ((29+32)/2).
In other words, to divide the set evenly (to arrive at the center), it separates 8 numbers before 29 and 8 numbers after 32.
If the dataset contains an odd total of numbers, after dividing the number of values in half, the center number becomes the median.
For example, should the age values used be 19 through 55 (leaving off the first 17 value), there would be only 17 Age values for MEDIAN.
To find the center value of 17 values, you simply isolate the first 8 values from the last 8 values and the center value would be 32 (19, 21, 22, 23, 24, 25, 27, 29, then 32, followed by 33, 34, 26, 40, 41, 44, 51, 55).
Mode
Mode represents a different focus of central tendency – the number found most often.
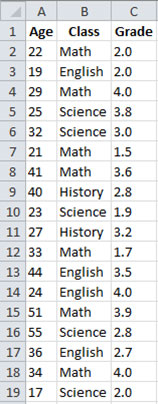
Starting with a similar dataset as above, we have 17 ages of college students.
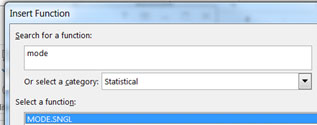
First, I’ll place my cursor next to the dataset where I wish my final mode result to display. Then, I click Insert Function.
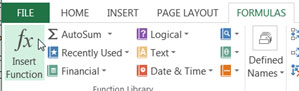
Select the Statistical category, MODE.SNGL function, OK.
With the cursor in Number1, select the entire dataset, OK.
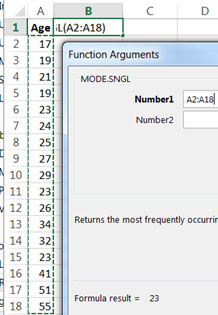
As you see from the dataset, 23 is the most-often occurring age in the class.