Using DataViews to debug data entering the pipeline.
I’ll begin this article using the same project to SQLServer to DataReader, export data from a table into a DataReader.
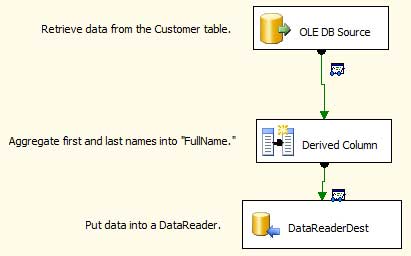
When this tutorial is complete your Package should look identical to the screen shot above, with two DataView icons next to each connecting green lines between the objects.
What is a DataView, what is it for?
Before we configure a DataView, let’s first understand its purpose.
With the robust power and control provided by SSIS, like any other type of development, it’s critical to understand at a granular level, the processes occurring, in this case, data moving around in the “pipelines” of a package, in order to ensure the project is working correctly. Also if something goes wrong, being able to see the data in a column format from within the pipeline greatly helps to understand where an error may lie.
Picking up where the last project left off, we are extracting rows of data from the “Customers” SQL Server database table, transforming two columns into one (“FullName”), then placing those rows of data into a DataReader object.
However, we shall add two points along the pipeline where we shall be able to view the actual data coming from SQL Server and after it’s been transformed, but before it enters the DataReader.
Configuring a DataView
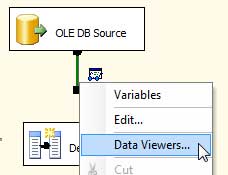
To configure a DataView, first right-click the green line connecting the “OLE DB Source” and “Derived Column” objects and select “Data Viewers…”
In the “Data Flow Path-Editor,” press “Add.”
On the “General” tab, select “Grid” as your choice for viewing the data (you may also choose Histogram, Scatter Plot, or Column Chart.
Next, select the “Grid” tab and add the desired columns whose data you wish to see in the pipeline at runtime.
When you are finished, press “OK,” “OK.”
Repeat the same process you just completed for green line connecting the “Derived Column” and “DataReaderDest” objects.
Your package should now have two DataView icons on the designer, one next to each green line.
Now run your package.
Using a DataView
Your package should execute up to the first DataView, display two pop up windows representing DataViews and stop.
The first DataView at which execution has stopped will have data from the pipeline displayed for your review.
Why does it stop?
Since a DataView acts as a “breakpoint” in the pipeline, it can’t proceed until you “Detach” the DataView, letting execution continue.
With each DataView, you may either: scroll through the current recordset, “Copy Data,” continue execution by pressing the play icon, or detach the DataView which also continues execution.
Once I’ve continue execution, the package continues to the next DataView and once again stops.
At this point the second DataView is populated and now I may see a “before and after” of the pipeline’s data between the two DataViews.
In this example, I am able to see the result of the “Derived Column” transformation of two columns into “FullName.”
When I’m done debugging the data, I have the same options as before with the previous DataView to continue execution, at which time, all objects will turn from yellow to green, signifying the package has completed execution.
