Understanding Variables & Unexpected Results
Analyzing data invariably presents results may seem confusing, especially when analyzing independent variables (IVs, link to article).
For example, let’s say you are analyzing age groups (IVs) to for the average chosen employment (Dependent Variable – DV).
You might think with respect to differing groups employment groups of trade and professional, the younger age group would comprise mostly professional, but you might be incorrect.
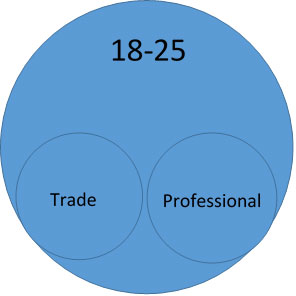
However, if your results show an even distribution of this age group between both employment groups, what might be the cause?
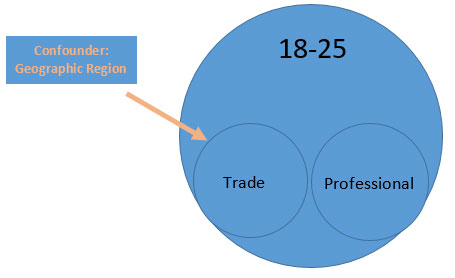
This type of study illustrates the existence of a confounder – a variable currently hidden from the study which might explain these results.
In this case, the study was missing another IV – geographic area. This particular study was conducted in a very industrial area which comprised several large employers of blue-collar jobs.